Singapore Residential Market Q2 2020
星期三, 19 八月 2020

URA Flash Estimates
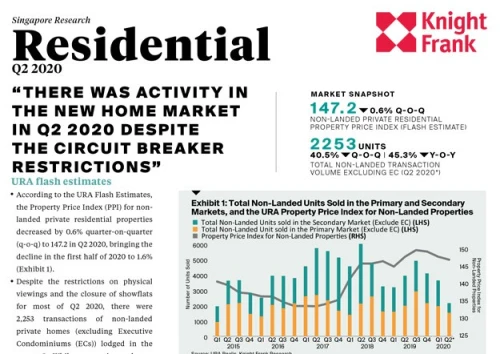
- According to the URA Flash Estimates,the Property Price Index (PPI) for nonlanded private residential properties decreased by 0.6% quarter-on-quarter (q-o-q) to 147.2 in Q2 2020, bringing the decline in the first half of 2020 to 1.6% (Exhibit 1).
- Despite the restrictions on physical viewings and the closure of showflats for most of Q2 2020, there were 2,253 transactions of non-landed private homes (excluding Executive Condominiums (ECs)) lodged in the quarter*. While transaction volumes were much lower, falling 40.5% q-o-q against Q1 2020, the sales activity showed that some buyers had adapted to these unprecedented conditions. Of the 2,253 transactions, about 70.6% or 1,591 were new sale transactions, with the remaining 662 being secondary sale transactions (Exhibit 1).
- New sale activity was down in April when the circuit breaker measures first kicked-in, recording 261 sales of non-landed private homes (excluding ECs). However, sales activity in the primary market improved as the quarter progressed, increasing to 455 and 875 transactions in May and June* respectively as developers’ discounts encouraged buyers. Secondary sales however continued to slide, with 145 in May and 218 in June* as compared to 299 in April.


